
Share the post "GIS and engineering – good practice"
The integration of GIS with traditional design and spreadsheet software for the development and planning of projects is still in its infancy in many parts of the world. Muhammad Khaliq reports on how he convinced colleagues to use GIS for Syrian Infrastructure project.
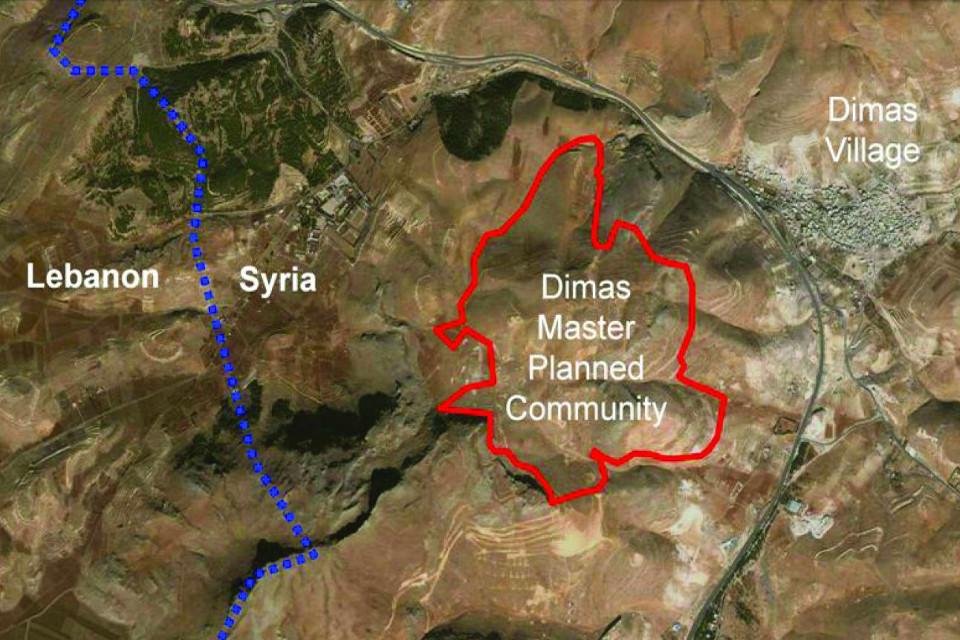
THERE IS A GENERAL IMPRESSION in the Middle East that GIS cannot help in engineering works. We have managed to change this perception through an infrastructure project north of Damascus in Syria. For the Dimas housing development project, with a population of 25 to 30 thousand people, our task was to design the infrastructure with a brief of plenty of walkable tracks and cycle safety to schools, shops, playgrounds and sports fields.
 The first challenge was to persuade and motivate colleagues to use new technology. We found that people like to work in traditional ways for planning and design, using AutoCAD and spreadsheets. It seems hard to get them to adopt GIS software in their planning and delivery despite the behavior – lack of knowledge of GIS, fear of trying new technology, fear of integration with existing traditional systems.
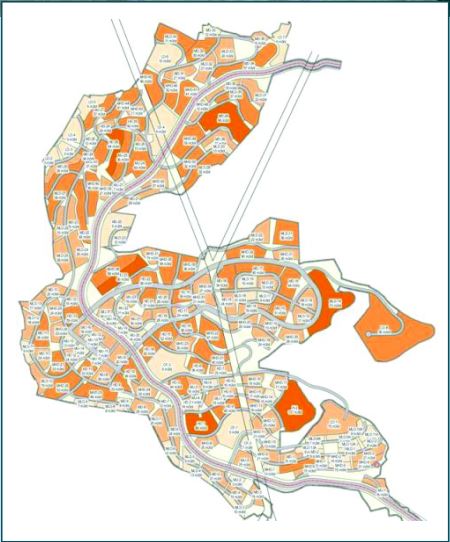
DWGs and spreadsheets: Somehow we managed to persuade our clients to use GIS in our scope of services, which is the planning and design of utilities for the whole development. For this purpose, we received planning information from master planner in DWG files and spreadsheet format, which looks great in terms of hachuring, coloring and layout setting but provides a challenge for us to integrate into GIS with error-free data from our design work.
We converted the CAD and tabular data into our geo-database. Spatial analysis helped us to identify gaps in the data provided by the planner. These gaps included duplicate parcel numbers assigned to more than one plot and the wrong association of development phasing in spreadsheets, e.g. parcel number 512 falls within boundary of phase 4 in AutoCAD but Excel version says it belongs to Phase 3!
After resolving all these issues, the next step was to calculate demand/load for individual plots for all utilities including: portable water, irrigation, sewerage, storm water, electrical and telecommunications. To achieve this we added columns in the spreadsheet, one for each utility and calculate the load/demand based on rates as per the standards set by local authorities.
Spatial analysis also helped us to identify suitable locations and sizes of sub-stations, water tanks and sewerage treatment plants.
Now we are in final stage or presenting our results. We have produced a series of maps and queries by simply re-linking a modified spreadsheet to planning in ArcGIS. We use annotation to show our design demand/load for individual plots and apply different symbologies to enhance the presentation.
Reference: gisprofessional.co.uk – Issue No 38 February 2011